Linux Performance Bottleneck Cheatsheet: The Top Utilities for Every Situation
A structured guide to diagnosing Linux performance problems layer by layer — from application and kernel, through filesystem and block devices, to the network stack, CPU scheduler, memory, and hardware. Covers classic tools alongside eBPF/BCC utilities and notable open-source monitoring projects.
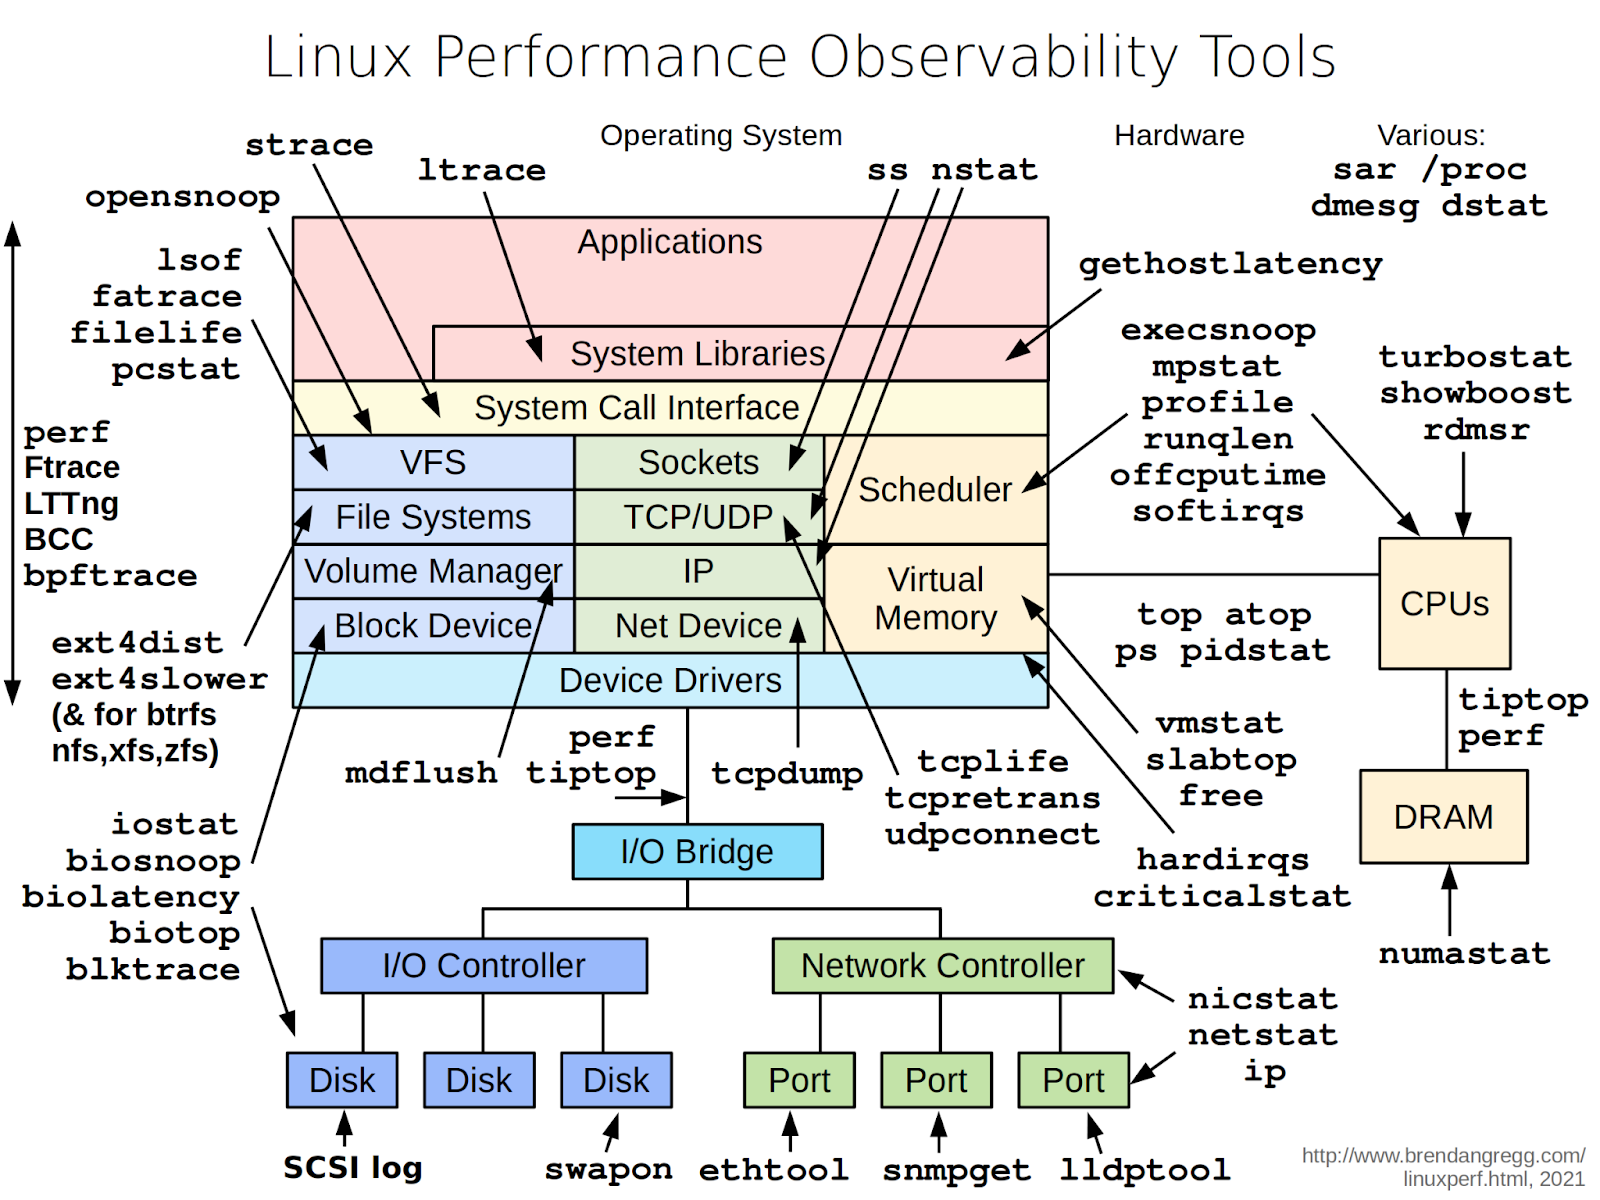
Many people have seen Brendan Gregg's classic diagram mapping CLI utilities to each Linux subsystem. It is a useful reference, but when things are on fire you tend to search the internet rather than methodically work through a diagram. This guide compiles those tools plus additional open-source utilities for monitoring, organised by subsystem so you can work top-down.
Tools are organised by subsystem. Open-source utilities are briefly described at the end of each section — details are available on their respective GitHub pages.
Applications and System Libraries
Performance problems typically originate here, because applications determine what load the kernel and hardware see. Common issues at this layer include:
- A single process consuming CPU with no obvious reason why
- An application that freezes periodically, stuck in a system call
- DNS resolution delays that appear to be network problems
- Resource leaks — typically file descriptors and sockets
- Short-lived child processes that complete between
topupdates
strace examines system calls, showing which calls are slow and how much time is spent in the kernel. The most practical invocation shows aggregate statistics:
strace -c -p <PID>ltrace does the same for dynamic library calls. Useful when strace shows nothing unusual but the application still consumes CPU or runs slowly:
ltrace -f ./myappgethostlatency catches DNS resolution delays — situations where performance seems network-related but actually involves DNS. This eBPF/BCC tool requires bcc-tools to be installed:
sudo gethostlatencyFor service-level logs, use journalctl rather than dmesg in systemd environments:
journalctl -u <service> -n 200 --no-pagerIf the problem remains unresolved after this layer, third-party tools to consider:
- rr — record/replay debugger that records and replays execution of an application and its process tree
- bpftrace — tracing language and tool for writing custom eBPF observations
- sysdig — universal system event sniffer
- lnav — log viewer and journal analyser with filtering and search
- procps-ng — process monitoring suite
System Call Interface and Kernel
When application-level analysis looks normal, go deeper. Kernel issues — a blocked driver, a problematic subsystem — manifest as slow system calls or a high percentage of time spent in kernel mode.
perf is the primary profiling tool. It exposes hardware CPU counters and shows which functions consume time. If kernel or driver functions dominate, the bottleneck is not application logic.
View overall CPU statistics:
perf stat -a -- sleep 2Profile a specific process with call stack:
perf top -g -p <PID>ftrace is the built-in kernel tracer. Via trace-cmd, observe how many times a system call executes and how long it spends in the kernel:
trace-cmd record -e sys_enter_read -e sys_exit_read
trace-cmd report
LTTng is a kernel and application tracing system for detailed temporal event correlation:
# Create a session
sudo lttng create syswide --output=/tmp/lttng-trace

# Enable kernel events
sudo lttng enable-event -k sched_switch,sched_wakeup
sudo lttng enable-event -k block_rq_issue,block_rq_complete
sudo lttng enable-event -k net_dev_queue,netif_receive_skb

# Start tracing
sudo lttng start

# Collect a sample (e.g. 30 seconds)
sleep 30

# Stop and finish
sudo lttng stop
sudo lttng destroy

# View the output
babeltrace /tmp/lttng-trace
eBPF/BCC utilities answer specific questions without modifying the kernel. Notable examples: opensnoop (tracks all open() calls), profile (frequency-based sampling), offcputime (sums time spent off-CPU), softirqs (interrupt timing), runqlen (scheduler run-queue histogram), execsnoop (watches process launches).
Third-party tools:
- Inspektor Gadget — system call and kernel behaviour analysis utilities for containers
- SystemTap — powerful kernel tracer with its own scripting language
File System and VFS
Problems at this layer typically involve how applications handle files, not the disks themselves. Mass open/close operations, constant metadata writes, thousands of small files, and descriptor leaks all stress the VFS layer and kernel caches, even when disk utilisation appears normal.
Start by checking what is open. lsof shows files, sockets, and devices opened by a process, and which processes are accessing a directory:
lsof -p PID
lsof +D /path/to/dir
The -p form is useful when a process hits its descriptor limit or when deleted log files still occupy disk space. The +D form reveals which processes are accessing a specific directory.
fatrace shows real-time filesystem activity — open, read, write, and close events. Identifies processes generating continuous small I/O or repeatedly rewriting files:
sudo fatrace -cFor short-lived files, filelife (BCC) shows processes creating and deleting files with very brief lifespans:
sudo filelifepcstat shows whether a file's data is in the page cache or must be read from disk:
pcstat somefileMonitor SLAB cache memory with slabtop. Rapidly growing inode or dentry caches indicate heavy file operations:
slabtopFor deep Ext4 diagnostics, ext4slower and ext4dist (BCC tools) reveal operation delays and latency distributions. Equivalent tools exist for XFS and Btrfs.
Third-party tools:
- Linux System Monitor — console and GUI monitor
- Baobab — scans local and remote folders and volumes
- QDirStat — cross-platform disk space visualiser with GUI
- Filelight — KDE tool displaying space usage as ring diagrams
Block Devices (Disks and Volumes)
Once the VFS layer shows high operation counts, determine whether the disk subsystem is keeping up. Queue depth, latency, I/O depth, and device state all matter here.
lsblk is the first command to run for orientation — it shows all block devices hierarchically:
lsblk -fiostat shows per-device load and latency. Extended output includes utilisation (util), operation count (tps), read/write throughput, and latency. Update every 2 seconds:
iostat -x -z 2iotop immediately shows which process is doing disk I/O — often the fastest way to identify a culprit during an incident:
sudo iotophdparm measures raw read speed and accesses low-level disk registers:
sudo hdparm -t /dev/sdanvme retrieves NVMe drive statistics, PCIe bus data, and error logs:
sudo nvme smart-log /dev/nvme0n1For detailed latency characteristics, eBPF/BCC tools are essential: biolatency (histogram of block I/O latencies), biosnoop (individual I/O events with PID and device details), biotop (processes ranked by I/O volume).
Third-party tools:
- Netdata — full-featured real-time monitoring with a web dashboard
- SysUsage — CPU, memory, I/O, network, and disk graphs via rrdtool
- Monres — lightweight VPS resource monitor with alerting
- Bandwidth Monitor NG — simple console network and disk I/O monitor
- tophat — GNOME Shell extension for resource monitoring
Network Stack
Network problems almost always manifest as slowness, but the cause varies widely: interface errors, TCP retransmissions, connection queue overflows, DNS delays. The diagnostic approach should start broad and narrow down.
ss replaces netstat and shows all TCP/UDP connections and sockets. It quickly reveals who is holding connections, which ports are listening, and whether SYN queues are filling up:
ss -tunapInterface statistics and routing use ip from iproute2:
ip -s link
ip route show
ethtool shows hardware-level network card properties and error counters:
ethtool -S eth0nicstat provides interface statistics: packets per second, bitrate, and average packet size. Run without parameters for a summary of all interfaces.
nstat reads the kernel's built-in SNMP counters. With -z, view all packet counters including zero ones:
nstat -zlldptool shows which switch port the server is connected to and what capabilities are advertised:
sudo lldptool -t -i eth0 -Vdropwatch is invaluable when packets disappear for no clear reason. It shows exactly where in the network stack packets are being dropped and distinguishes driver drops, stack drops, and filtering drops:
sudo dropwatch arpsolisten shows which processes are listening on ports and catches backlog overflow moments:
sudo solisten

# With 1-second update interval:
sudo solisten 1
BCC TCP tools: tcplife (tracks TCP session durations), tcpretrans (identifies retransmission problems), tcpdump (full packet capture for the CLI).
Third-party tools:
- EtherApe — graphical network monitor with node and traffic visualisation
- Simon — shows network activity on status panels
- Linux-Resource-Monitor — browser-based live traffic graphs
- ntopng — web-based network traffic monitoring
Scheduler and CPU
Scheduler and CPU problems manifest as rising load averages, long run queues, many processes in R state, or unexpected load concentration on specific cores. The cause may be application logic, interrupt storms, or hardware-specific behaviour.
Basic CPU Picture
mpstat shows per-core load and immediately reveals whether load is spread evenly or concentrated on one or two cores:
mpstat -P ALL 1pidstat maps load to processes. High load typically surfaces here:
pidstat -u 1Real-time monitoring: top, atop, htop, btop. Also worth knowing: tiptop — a top variant that shows hardware performance counters per process.
Queues and Scheduler
When load is high but CPU utilisation is not fully maxed out, check the scheduler run queue length with BCC's runqlen:
sudo runqlen 1If processes regularly queue up, either the CPU cannot service them fast enough or there is a core imbalance issue.
Profiling
Once it is clear that the CPU is busy, profile with perf. Show time-consuming functions with call stacks:
perf top -g -p PIDHardware counters — cycles, instructions, and cache misses:
perf stat -e cycles,instructions,cache-misses -p PID sleep 1Few instructions per many cycles, or a high cache-miss rate, points to a hardware-level profile rather than an algorithmic one.
Interrupts
Unusual load distribution or suspected interrupt storms: use BCC utilities to summarise softirq and hardware IRQ processing time:
sudo softirqs
sudo hardirqs
CPU Hardware Level
turbostat displays per-core frequency, C-states, temperature, and power consumption in real time:
turbostat 1rdmsr (msr-tools package) reads CPU model-specific registers for low-level diagnostics:
sudo rdmsr 0x10Ashowboost shows whether Turbo Boost is actually engaging under load, per core:
sudo showboostThird-party tools:
- Parca Agent — continuously samples user and kernel stack traces at 19 Hz, producing pprof profiles
- FlameGraph — builds flame graphs from perf, eBPF, and other profiling sources
- Scalene — advanced profiler that separately attributes CPU time, system time, and memory pressure
Memory and Cache
Typical memory problems: insufficient memory, active swapping, fragmentation, bad pages, or incorrect NUMA distribution on multi-socket systems.
free for a quick overview:
free -hvmstat provides dynamic process, memory, swap, I/O, and CPU statistics together. Set a 2-second interval:
vmstat 2Non-zero values in the si (swap in) and so (swap out) columns almost always explain response-time degradation.
On multi-socket systems, understand where memory lives with numastat:
numastat
numastat -p PID
Growing dentry, inode, or other kernel structure caches show up in slabtop (covered above). For behaviour over time, use sar:
sar -r 1   # memory statistics
sar -W 1   # swap statistics
Useful for distinguishing one-time spikes from sustained trends.
When memory "vanishes" and standard tools give no answer, use memleak (BCC) to find non-freed allocations with call stacks:
sudo memleakoomkill shows which processes were killed by the OOM Killer and when:
sudo oomkillAdditional useful commands: mdflush (tracks mdraid flush operations during RAID diagnostics), swapin (shows per-process page swap-in delays), and sorting processes by resident memory:
ps aux --sort=-rssThird-party tools:
- memray — Python memory profiler with flame graph output
- heaptrack — tracks all C/C++ memory allocations with full stack traces
Hardware Level
When all metrics look normal but the system still misbehaves, the problem may lie lower: CPU frequency scaling, thermal throttling, memory bus saturation, or device health issues.
Hardware-level perf counters give the first signal:
perf stat -e cycles,instructions,cache-misses -p PID sleep 1Check the current CPU frequency scaling policy:
cpupower frequency-infoDevice health via SMART:
sudo smartctl -a /dev/sda
sudo nvme smart-log /dev/nvme0n1
Temperature, voltages, and power status via BMC/IPMI:
ipmitool sensorOr via lm-sensors:
sensorsOverheating or voltage drops sometimes explain unusual behaviour that appears only under load.
For a quick snapshot of the whole system in a single output, dstat combines CPU, disk, network, and memory metrics:
dstat -tcmndThird-party tools:
- Open Hardware Monitor — popular cross-platform hardware monitor
- hwinfo — hardware detection library and CLI tool
- lshw — detailed computer hardware configuration reporter
Conclusion
The diagnostic approach is straightforward in principle: start at the application layer, confirm or rule out problems at each level, then go one layer deeper. Use standard tools first — they are fast, widely available, and usually sufficient. When they give no clear answer, reach for the eBPF/BCC utilities, which can answer very specific questions with minimal overhead. For deeper study of this methodology, Brendan Gregg's website and books are the definitive reference — though be warned: it is easy to spend hours there.