Understanding NTSC composite video and whether it's worth exploring in 2025. Part 1
Previously, circuitry solutions were required to generate a composite video signal, but now the problem can be solved using a microcontroller and a digital-to-analog converter. The microcontroller has enough performance to generate a signal with a sufficient degree of sampling, a
Editor's Context
This article is an English adaptation with additional editorial framing for an international audience.
- Terminology and structure were localized for clarity.
- Examples were rewritten for practical readability.
- Technical claims were preserved with source attribution.
Source: original publication
Previously, circuitry solutions were required to generate a composite video signal, but now the problem can be solved using a microcontroller and a digital-to-analog converter.
The microcontroller has enough performance to generate a signal with a sufficient degree of sampling, and a digital-to-analog converter can be assembled using a minimum of electronic components. Naturally, the quality of such a composite video signal will be low, but I think the “Wow” effect and the ground for experimentation will be provided.
The idea of generating a composite signal may seem trivial, since you can easily find examples of generation on the Internet. But I have not seen a systematic description of this topic and I want to correct this shortcoming. Initially, I wanted to put this in the form of one article, but then I decided that it was better to put it in the form of a series of two articles, since the volume of one turned out to be intimidating.
At school we were given knowledge, but rarely told where it could be useful. Once again I was convinced that knowledge is power. Knowledge of linear algebra, trigonometry, differential calculus, optics, electromagnetism, biology, physiology and other disciplines allowed humanity to create television.
Unfortunately, it is impossible to include everything even in a series of articles, just as it is impossible to include sensations in moments of insight, when you find something new in a seemingly already familiar topic. I hope that readers will learn something new too.
Anyone interested in passing a few evenings or wanting to improve their knowledge and skills is welcome further.
The ability to generate a composite video signal affects many disciplines that are studied at school and college, and understanding allows you to systematize knowledge and interdisciplinary connections.
In this article we will limit ourselves to only theoretical information; the next one will be devoted to how exactly to receive a video signal on the Raspberry Pi Pico.
I remember a picture from my childhood when a TV repairman with a diplomat came to fix our TV. Then it seemed that the TV master had knowledge bordering on magic; I still partially have this feeling, but I want to reveal a little the secrets of this magic.
When presenting a broad topic, the question always arises of choosing the most optimal sequence for presenting the material. I got the following one. I always welcome constructive criticism and advice for improvement.
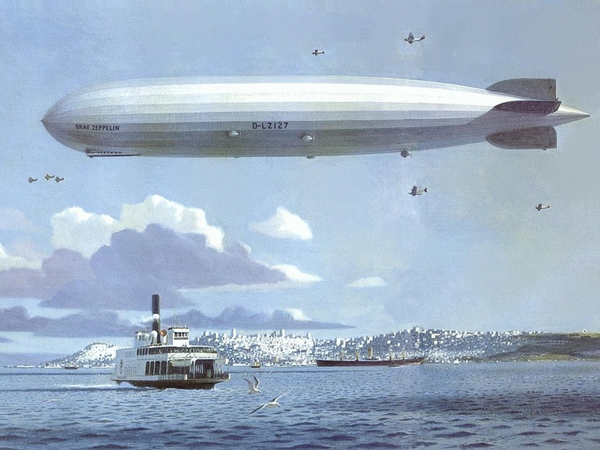
From now on I will refer to the composite signal as a CVBS (Composite Video Baseband Signal) signal. This is the “pure” analog video signal before it is modulated before transmission over radio or cable networks. Nowadays, analogue television, with some exceptions, is not used on the air. But the CVBS signal continues to be used in CCTV cameras, when digitizing old video from video tapes and in retro consoles.
Introduction to Analog Video Signals
A signal is a way of transmitting information by changing a quantity. Which quantities change and how they change determines the nature of the signal—it can be analog or discrete. The video signal carries information about the image; it can be analog when the values change smoothly and digital when the values change discretely. Exactly what quantity changes depends on the transmission medium. If the transmission medium is an electrical circuit, then it is usually voltage. This article discusses just such a video signal.
Why is it useful to know analog video signals?
Nowadays digital video signals are mainly used, but understanding analogue ones is important, since modern technologies are based on the mathematics and standards used for the latter.
Modern digital video uses:
color spaces and principles of coding color information (RGB, YUV, YIQ, primary colors, white point, color gamut);
scan, vertical and horizontal synchronization;
test charts (SMPTE Color Bars or EBU Color Bars).
Analog video signals are used in car rear view cameras, CCTV systems and FPV drones. Analogue technologies continue to be relevant in retrogaming, restoration of old TVs and enthusiast projects.
Variety of signals, coding standards and connection interfaces
A video signal must be distinguished from a television signal. A television signal is a video signal modulated for transmission at radio frequencies. I do not consider it in this article.
Video signals are available in black and white and color. Black and white were developed earlier - in the 30s, and only in the 50s did television become color. The difficulty with color video is that color information must be conveyed.
A color image can be represented using combinations of red, green and blue. On TVs and monitors you can see many tiny dots of red, green and blue. There are standards that actually transmit information about red, green and blue colors: RGBS, RGBHV, VGA.
For color video signals used in television, it is more common to transmit luminance (Y) and two color difference signals (usually referred to as U and V). This decision was made to ensure compatibility with black-and-white television and to save bandwidth, since the television signal uses radio frequencies.
The signal can be in different color coding systems: NTSC, PAL, SECAM. Modern TVs are multi-system, and the user may not even know what color system his signal is in.
I know of three NTSC standards:
NTSC-M,
NTSC-J,
NTSC 4.43.
NTSC-M is the American version of NTSC. NTSC-J is a color television system in Japan and some other countries; The system is more conservative. NTSC 4.43 is NTSC that uses PAL chrominance frequencies to modulate the chrominance signal.
A modern TV can receive analog and digital television and video signals. Therefore, when examining the back panel of the TV, it often dazzles the eye.
For example, even my TV, which is over ten years old, contains the following inputs:
high-frequency input for cable and regular television (RF);
multiple low-frequency inputs for CVBS signals;
component video input;
VGA video input;
several HDMI inputs.
But don't be alarmed, we will only be looking at a CVBS color signal with the NTSC-M encoding system and we only need a yellow RCA connector on the TV.
Scan
The image on a TV screen is a sequence of rectangular frames that consist of lines. Scan converts a two-dimensional image (frame) into a one-dimensional sequence of lines that is transmitted.
Initially, scanning was intended for cathode ray tubes (kinescopes), where the image was drawn by an electron beam. It took time for the beam to move to the beginning of the line or to the beginning of the screen. The time intervals allocated for these movements are called vertical and horizontal synchronizing intervals.
Such intervals are not necessary with digital displays currently in use. That is It was possible to display the image without them, but the intervals were left for compatibility.
Scanning can be progressive or interlaced. With progressive scanning, lines are transmitted sequentially - one after another. With interlaced scanning, the odd lines of the frame are transmitted first, then the even lines of the frame. All even or odd lines of a frame are called fields. Those. First, the field containing the odd frame lines is transmitted, then the field containing the even frame lines.
Depending on the CVBS signal standard (NTSC, PAL, SECAM), a different number of lines per frame is used. In the case of NTSC this is 525 lines. Those. each field contains 262.5 lines.
In the case of interlaced scanning, odd fields begin with a whole line, even fields with half a line; Thanks to this, the signal decoder understands which field is currently being transmitted - even or odd. Not all 262.5 lines are displayed on the screen and are an image.
A schematic diagram of what the two types of scans look like is shown in the figure.
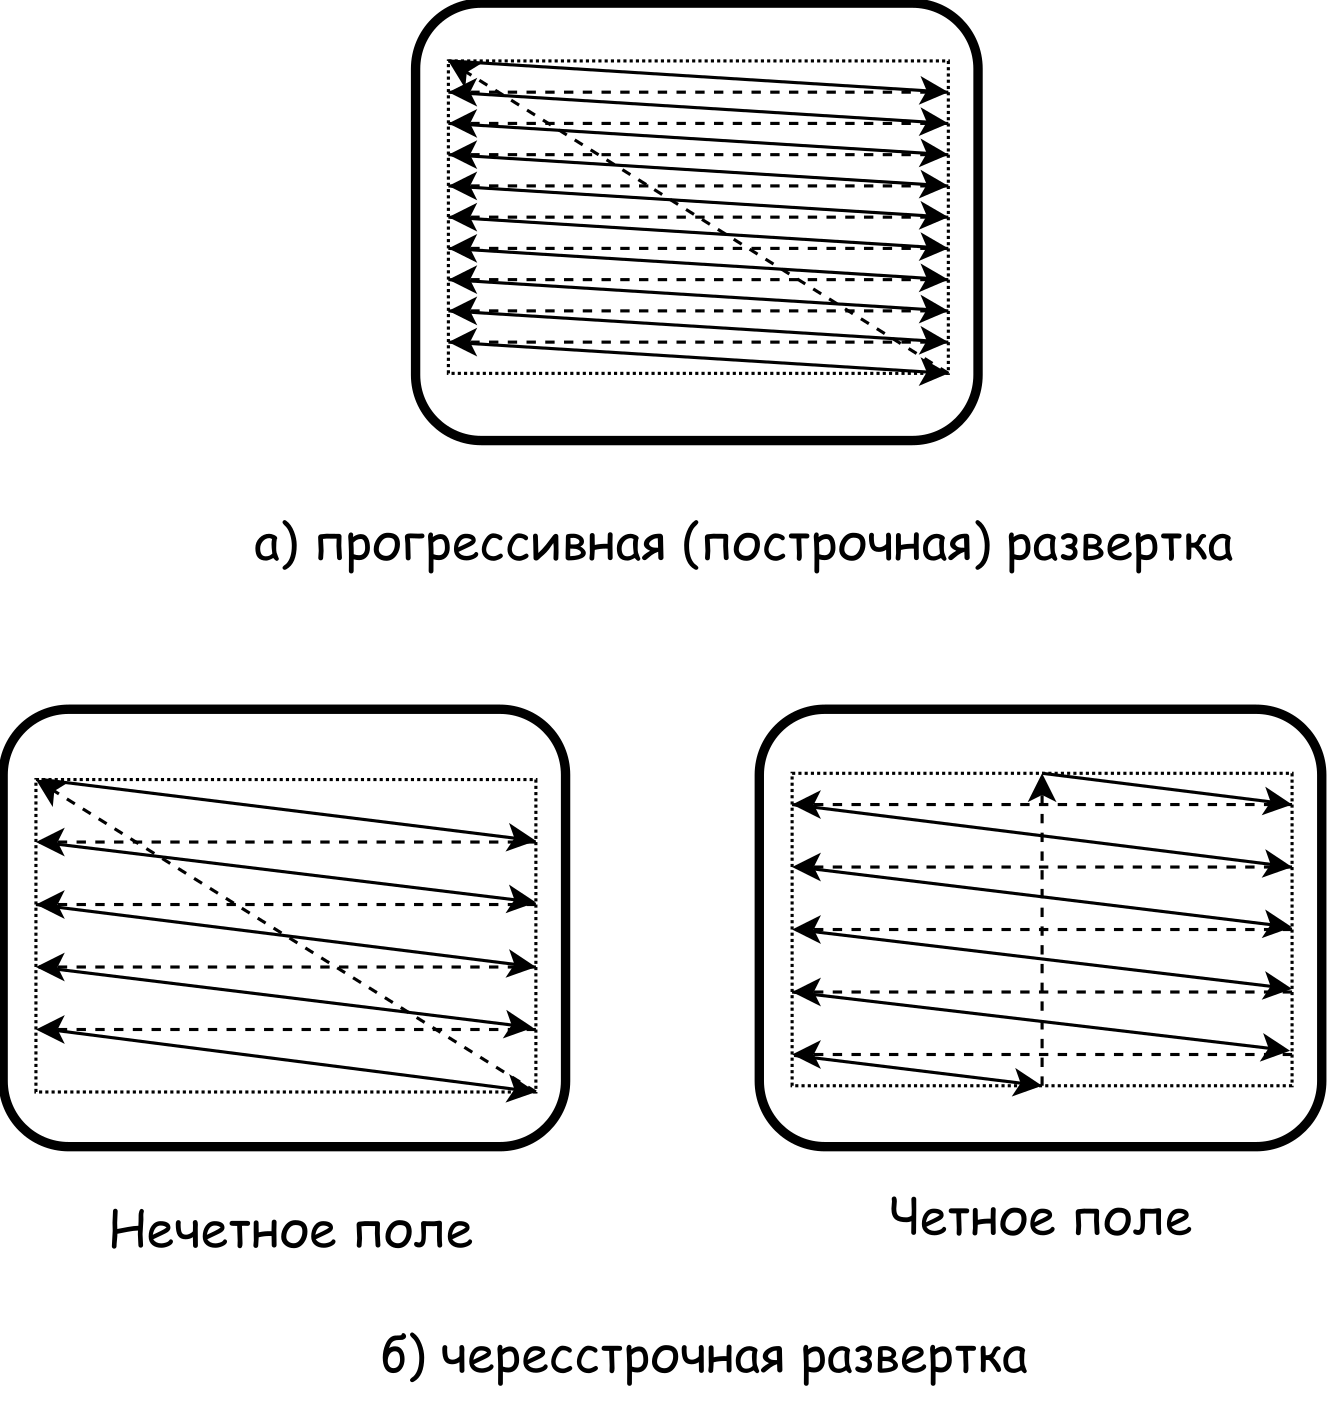
The dotted lines show the reversal of the beam when it is extinguished. In fact, the trajectory of the extinguished beam is different; The diagram makes it easier to understand.
CVBS color video signal
Formalization of the concepts of color and brightness
A full understanding of the CVBS color signal is impossible without formalizing the concept of color, so let’s consider it.
What is color? An entire discipline is dedicated to this - colorimetry. Many books, articles, and videos have been created on this topic. There are also a number of articles on é. I will limit myself to only the basic concepts, and in useful links I will indicate where you can find additional information.
I think there is no person who has not seen a rainbow and does not know the names of the colors that are present in it.
Visible light from a physics point of view is electromagnetic waves with a range from 380 to 780 nanometers. They can be emitted, reflected and absorbed. The emission or reflection of waves with certain wavelengths is perceived by us as color.
In fact, there are an infinite number of colors, and a person distinguishes only a part of them. In the rainbow we see so-called monochromatic colors, i.e. those produced by the emission or reflection of light of a single wavelength. The colors we see in everyday life contain different wavelengths and have a complex emission spectrum.
From a school biology course we know that in human eyes there are rods and three types of cones to perceive light. The human eye has different sensitivity to red, blue and green.
In 1931, the International Commission on Illumination (CIE) conducted a colorimetric experiment. It involved creating color matching functions that describe how the colors of the visible spectrum can be represented through the combination of luminances of three monochromatic colors. This experiment became the basis for the development of the CIE 1931 XYZ system, which standardized human color perception.
Many people know what the CIE 1931 chromatic diagram looks like, but not what it shows and why it is needed.
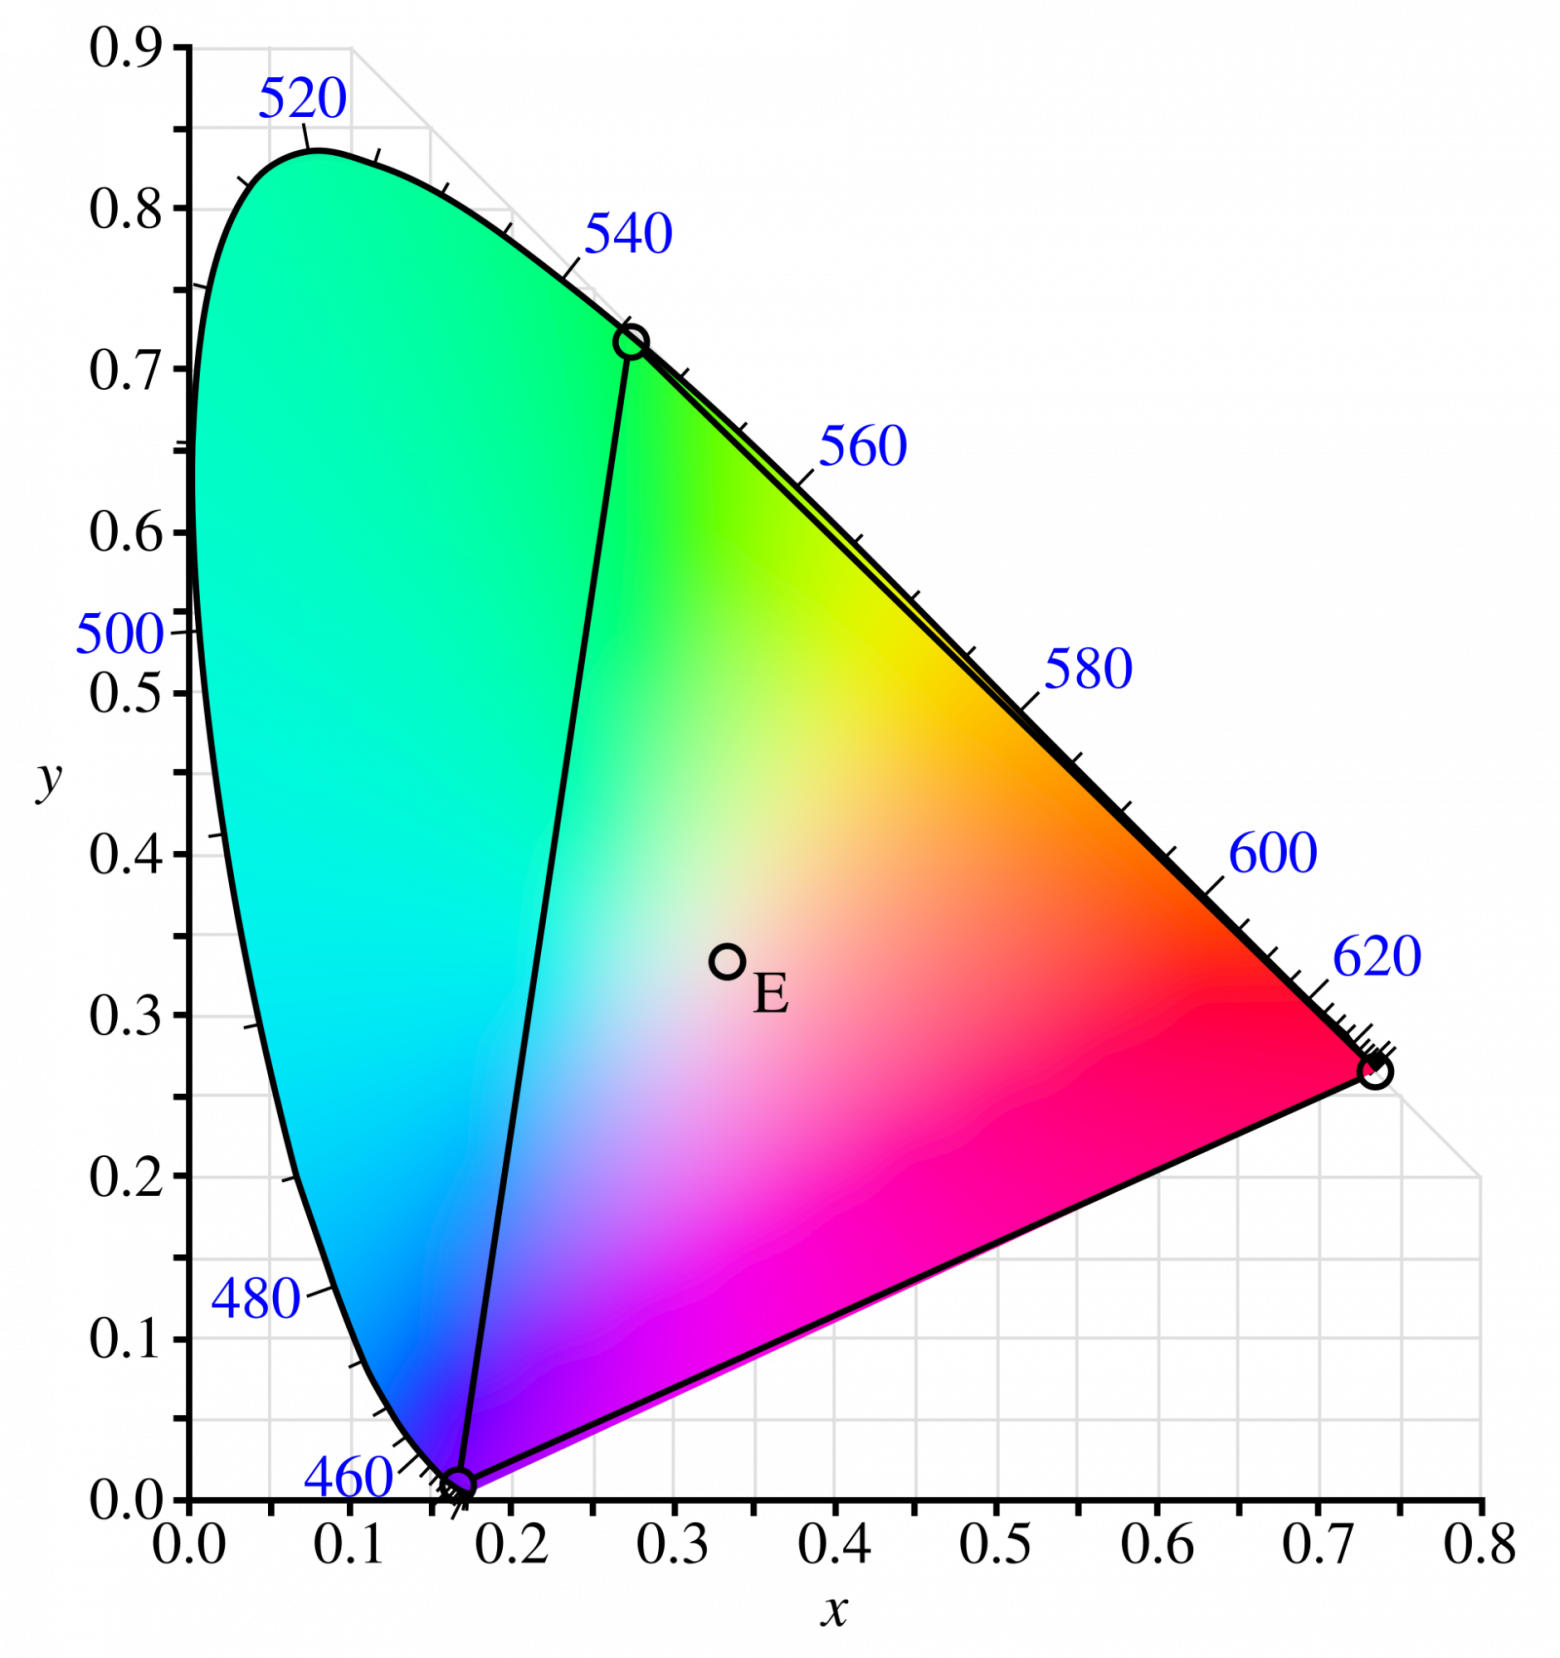
The diagram shows all the colors that are perceived by humans at maximum brightness.
Chroma is a combination of hue and saturation.
The color (without the brightness component) in the diagram is determined by two coordinates: x and y. If you select three points on the diagram, then the triangle formed by them will contain all the colors that can be created by mixing the three colors of its vertices in different proportions. These three points are called color primaries.
The colors inside this triangle determine the color gamut.
The fourth point, which is called the white point, is also important. It shows how a color with saturation equal to 0 will be perceived.
The white point for the xyY color model, for which the CIE 1931 diagram was constructed, has coordinates ⅓, ⅓. But in the color models used in television and photography, it has different coordinates. Often a combination of letters and numbers is used for the white point. For example, E, C or D65
Color image encoding
Luminance signal (Luma)
The classic formula that relates colors and brightness is:

Where:
 — brightness value,
 - meaning of red color,
 - the meaning of green color,
 — blue color value.
This formula was originally used in the NTSC system, but PAL and SECAM use it to encode luminance. If you dig deeper into the topic, the formula for other standards (PAL and SECAM) is a bit misleading.
The coefficients for R, G, B are not taken out of thin air - they can be derived mathematically; I leave this fascinating task to the reader.
The formula is convenient to use to quickly convert a color image to black and white. Unfortunately, the reverse process of obtaining a color image from black and white is not so simple, but AI is now showing good results.
Chroma signal
To specify a color, you need to know its location in color space. Analogue television uses YUV and YIQ color spaces.
In NTSC, you don't have to use the YIQ color space, but use YUV. This is especially true for color production with retro consoles.
To encode a color, you need three values, but they don't have to be red, green, and blue.
In YUV and YIQ spaces, this is the brightness, as well as the differences between blue and brightness and red and brightness.
To convert from RGB to YUV space, use the following formulas:


The coefficients 0.493 and 0.877 were selected so that the amplitude of the color signal fell within a certain interval.
The range of R, G, B and Y values can be anything, but typically the values are [0..1], [0..100] or [0..255].
Where are the values for green? It can be determined from the brightness formula.
The YIQ color space differs from YUV in that the I and Q axes are the V and U axes rotated by 33°. The 33° rotation was determined experimentally so that the axis coincides with the line of orange-blue tones. This line is called skin tone line.
The color difference signals can be clearly seen in the following diagram.
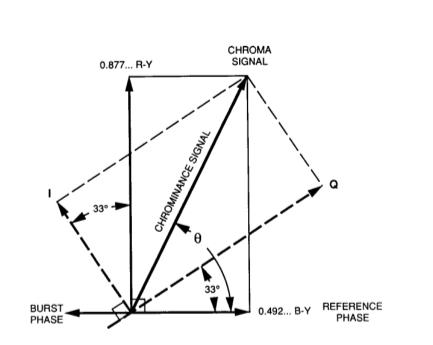
Vector rotation angle  determines the color hue, and its length determines saturation.


Corner lies in the range [0, 360°], but  maybe [-π/2, π/2].
Therefore, to get the correct in the range [0, 360°] it is necessary to take into account the quadrant (U and V signs) and convert the result  , adding π or 2π if necessary.
Knowing the basics of trigonometry and linear algebra, you can derive the coefficients in the formulas for I and Q. To do this, use the rotation matrix:

You can also write it in a more familiar form of a system of linear equations:

Knowing Y, U and V, you can get the values of R, G, B.

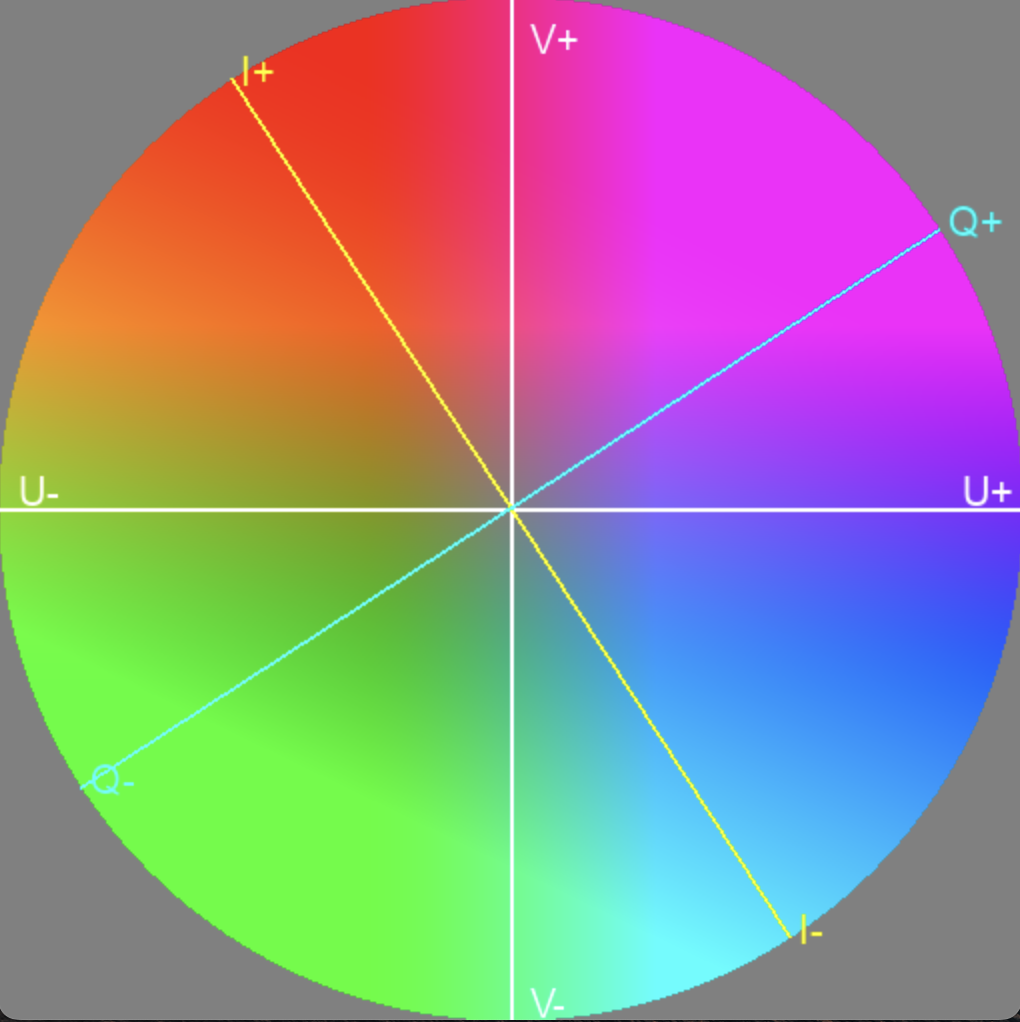
It is convenient to represent color on a color wheel, where a point with coordinates U and V has an RGB color depending on Y, which varies from 0 to a maximum value. Those. The color wheel is actually a color cylinder, but the color wheel is usually depicted by fixing the brightness, since it is more convenient to work with a two-dimensional image.
Brightness coding
We have already seen that brightness is encoded as follows:
If the signal is encoded NTSC, R, G and B can take values from 0 to 100 IRE. The maximum brightness value that can be obtained using this formula is 100 IRE. More on what IRE is later.
Chroma coding
To transmit chrominance, two color difference signals are used, but with NTSC, as with PAL, they are packaged into one chrominance signal. This becomes possible using quadrature amplitude modulation (QAM) of color difference signals.
The essence of this modulation is that amplitude modulation of two signals is first performed, after which the phase of one modulated signal is shifted relative to the other by 90°, and then they are added.

Where  — common-mode component,
  — quadrature component.
The use of I and Q in this formula is a little confusing, because if I and Q are NTSC color difference signals, then the formula is:

If we transmit color difference signals U and V, then V modulates the in-phase carrier and U modulates the quadrature carrier.

I specifically used S(t) and C(t) to distinguish between the general case of QAM modulation (S(t)) and color difference QAM modulation (C(t)).
Previously, we discussed that when encoding color, the rotation of a vector determines the hue of the color, and the length of the vector determines the saturation. In the case of a sinusoidal signal obtained after quadrature modulation, the angle is the phase and the length of the vector is the amplitude.
Since the color difference signals were modulated using a single frequency, with a constant value the result will be a sinusoidal signal, and if the values change, the signal will be a piecewise function of sinusoids with changing phases.
The beauty of quadrature amplitude modulation is that the amplitudes of the two signals are converted into phase and amplitude.
NTSC video signal
The Soviet Union used the SECAM color system; attempts to use NTSC were only made in the early days of color television. Literature on television produced in the USSR should be read with caution. Russian-language terminology regarding television signals is not as established as English-language terminology. Terminology is defined by GOST 21879-88. I believe that the English language better reflects the essence, and there is a difficult question of how to use the terminology without misleading the reader. But I think once you understand the essence of video signals and read a couple of books, this problem will disappear on its own.
NTSC Composite Signal Structure
Previously, we got a basic understanding of color scanning and coding. Let's move on to the specific implementation - NTSC.
A composite signal is called composite because it contains several signals:
brightness signal (luma),
color signal (chroma),
synchronization signals (horizontal, vertical and color).
Signal levels and IRE units
A signal is a change in quantity over time that conveys information. Depending on the transmission medium, these can be different physical quantities.
In NTSC, the quantity is the abstract unit IRE. 100 IRE means maximum brightness (white level), 7.5 IRE means minimum brightness (black level), and 0 IRE means no brightness signal (Blank Level).
In general, the signal value can vary from -40 IRE to 133 IRE.
Negative values (-40 IRE) are used to transmit clock pulses. Color burst values can range from −20 IRE to 20 IRE.
Values from 100 IRE to 133 IRE are obtained only when transmitting color information.
In the case of signal transmission using a voltage of 140, IRE is equal to 1V. Accordingly, 1 IRE is approximately equal to 0.713 mV.
The IRE can be clearly seen when examining the waveform for one line of a CVBS NTSC signal.
CVBS NTSC waveform for one line
To better understand the NTSC video signal, here is an oscillogram for one line of the image. Most likely, much will be incomprehensible, but as you read the article, understanding will come to you, and you will be able to draw it from memory.
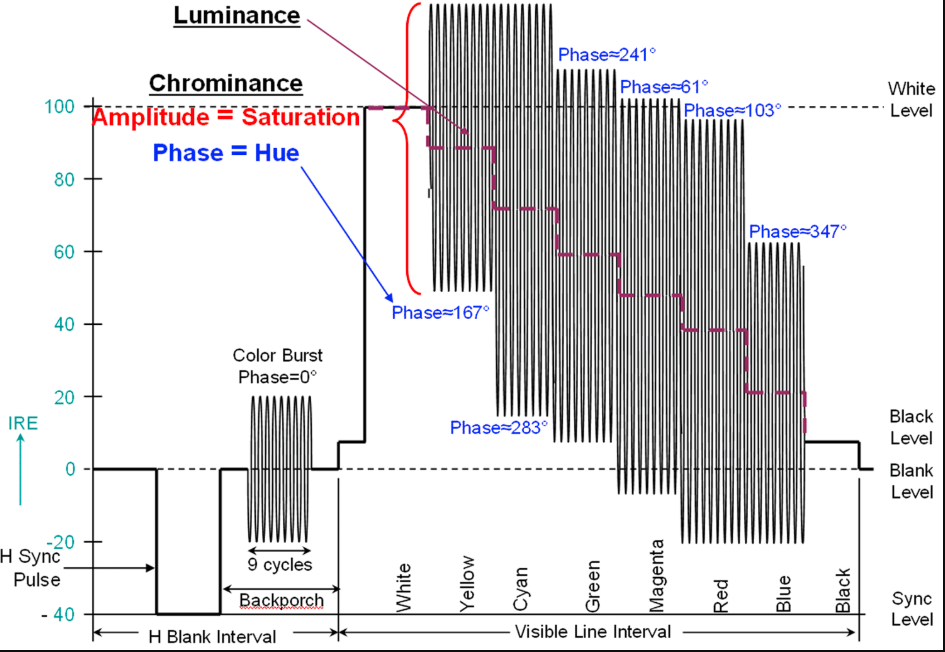
This waveform is important because it clearly shows how the image line is represented as a signal. This is especially useful for analyzing signal structure, checking timings, levels and phase of the color subcarrier. As a rule, waveforms built for the SMPTE Color Bars and EBU Color Bars test images are analyzed. SMPTE Color Bars allow you to check more signal parameters.
I also present the oscillogram in a simplified form, without clutter, for better understanding.
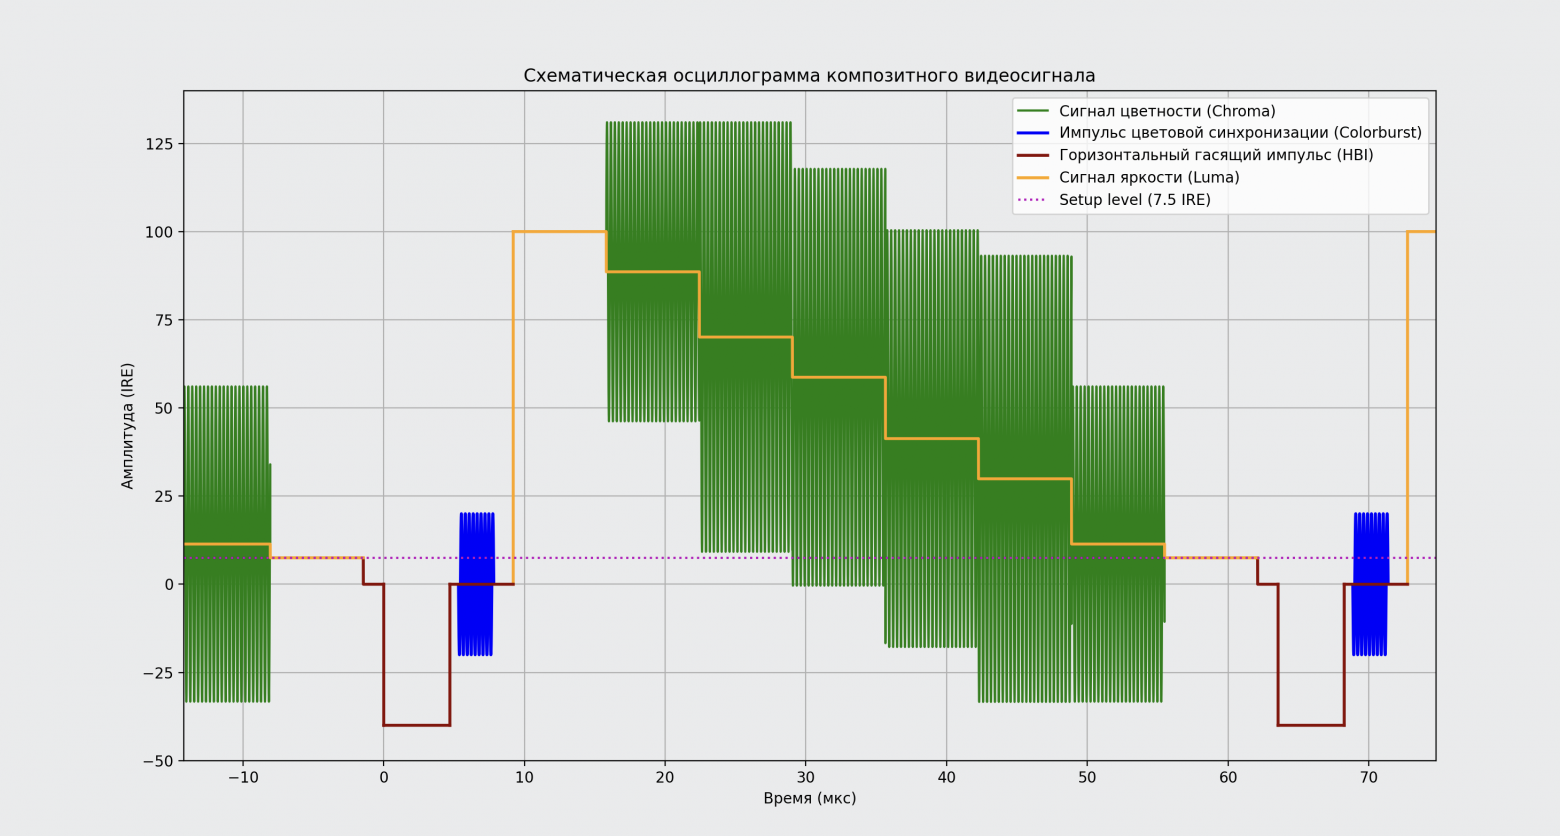
Brightness and color
The CVBS NTSC signal is the sum of the luma Y signal, the chrominance C signal, and the clock signals. But in the NTSC standard there is also a Setup level equal to 7.5 IRE, which determines the signal level when transmitting black. Therefore the formula will look like this:

Or:

Usually the literature for NTSC states that the color space is YIQ, but in fact it may be YUV in the case of equiband encoding. Rotating I and Q by 33° is important for more accurate rendering of skin tones, but is often neglected for the sake of simplicity.
The formula using I and Q adds radians to degrees, which is not mathematically correct, but that is how it is given in the NTSC specification.
The hue of a color is determined by the phase shift of the chrominance signal relative to the color subcarrier (eg, red: 103.5°, yellow: 167.5°). The reference phase for decoding the chrominance signal is set by the color sync pulse.
Horizontal and vertical damping pulses
In English-language literature, horizontal and vertical damping pulses are called Horizontal Blanking Interval (HBI) and Vertical Blanking Interval (VBI), which more accurately reflects their essence, since the emphasis is on the interval rather than the pulse.
During VBI, the electron beam is blanked and moved to the first line of the frame or field; during HBI, the electron beam is blanked and moved to the next line.
Horizontal Blanking Interval is often called HBLANK, and Vertical Blanking Interval is VBI.
HBI consists of:
front porch
synchronizing pulse (sync pulse),
back porch.
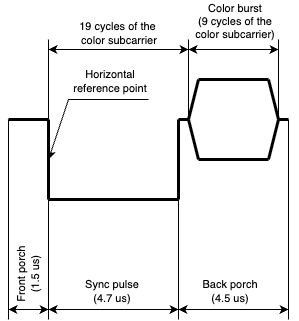
In the case of a color video signal, the back porch contains a color burst, but more on that later.
The HBI looks like this:
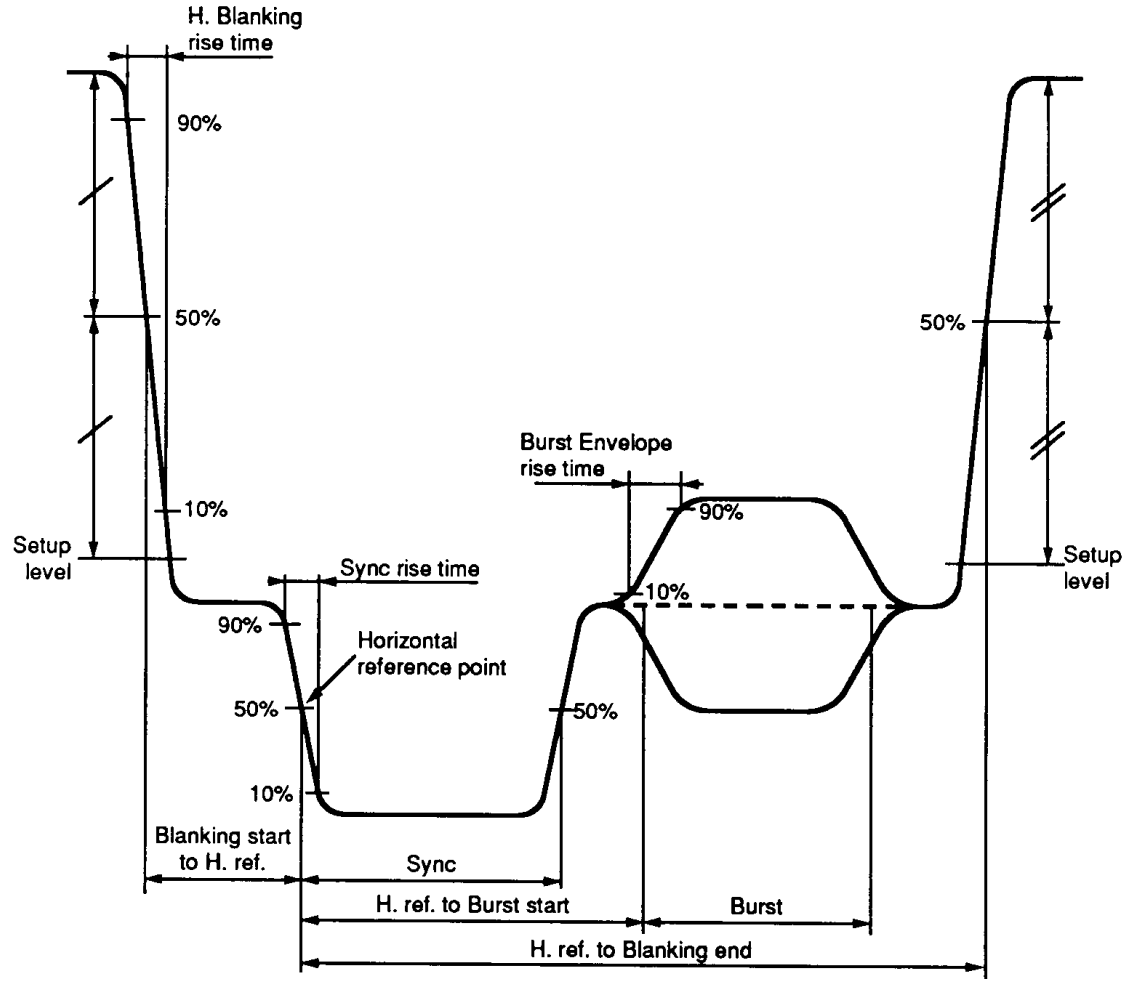
Or a simplified waveform, for clarity:
VBI has a more complex structure than HBI. It consists of:
equalizing pulses (pre-equalizing and post-equalizing pulse intervals),
personnel sync pulses (serrations),
horizontal sync pulses (h-sync).
According to the specification, the NTSC composite signal uses interlace scanning. The TV's synchronizing circuits must work correctly for even and odd fields, so equalization pulses with a frequency twice the line frequency are transmitted before and after the vertical sync signal. Since the vertical synchronization signal occupies an interval equal to the period of 3 lines, so that the synchronizing circuits do not go astray, it includes vertical sync pulses (serrations), also with a frequency twice the period of one line.
The VBI looks like this:
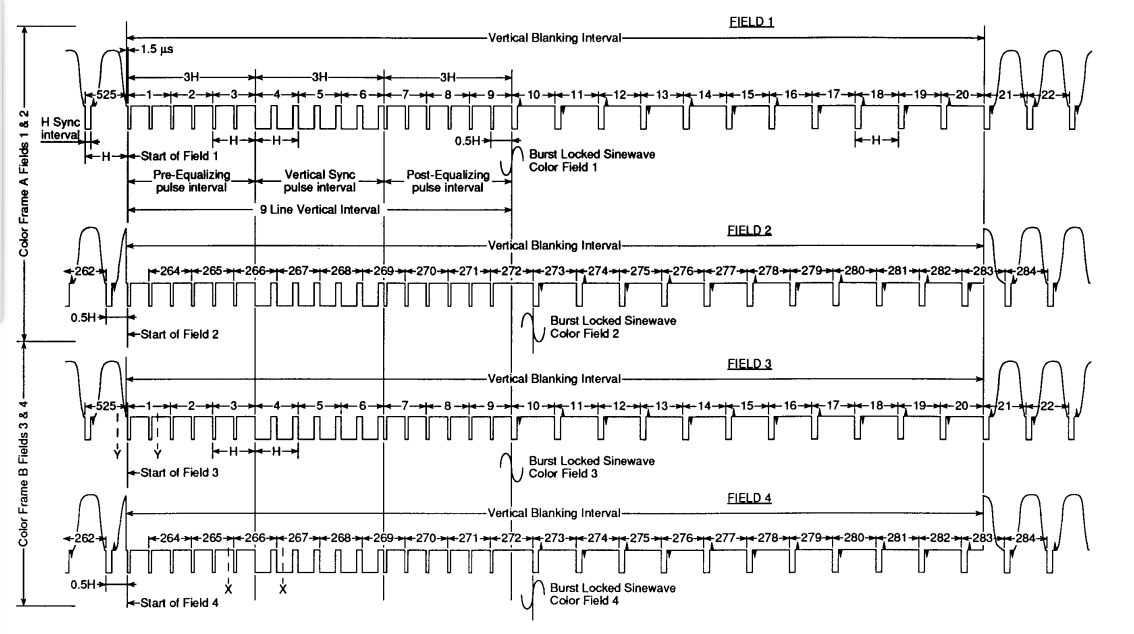
VBI can transmit additional digital information, such as teletext.
A complete understanding of VBI requires a more detailed consideration of the video decoder design, so we will limit ourselves to the above information.
By using pseudo-progressive scan, VBI can be simplified, which is what the developers of consumer computers and game consoles of the past did.
Color subcarrier
For the engineers developing the NTSC standard, one of the main tasks was to find a way to convey color information. This problem was solved using quadrature amplitude modulation (QAM) with color difference signals of a carrier frequency, which is called a color subcarrier.
According to TSB, the carrier frequency is the frequency of harmonic oscillations that are modulated by signals for the purpose of transmitting information. High-frequency vibrations themselves do not contain information, they only “carry” it. Harmonic oscillations with a carrier frequency are called carrier waves.
Most sources use the term color subcarrier. However, I believe this term is incorrect when applied to CVBS, since CVBS is a basic signal without a common carrier. Therefore, in the context of CVBS it is probably more correct to say “color carrier”, whereas in an RF TV signal the term “subcarrier” is appropriate, but I will not abandon the generally accepted terminology.
NTSC uses quadrature amplitude modulation (QAM) to transmit a color signal, which involves suppressing the carrier frequency, i.e. To demodulate a chrominance signal, the receiver needs to determine this frequency. For each line of the image, only a reference signal with the frequency of the color subcarrier is transmitted in the form of a pulse of 9 harmonic oscillations (from 8 to 10) with a phase shifted by 180°. This impulse is called colorburst in English-language sources.
The color subcarrier frequency in the NTSC standard is 3.579545 MHz.
Color Burst
The color burst pulse carries information about the frequency and phase of the color subcarrier. It is transmitted in each scan line, with the exception of lines with equalizing pulses and vertical synchronization pulses. There was no need for it in black and white television.
It begins after 19 subcarrier periods from the start of the horizontal reference point. Has a range of 40 IRE from -20 IRE to 20 IRE.
When using interlaced scanning, 227.5 periods of the color subcarrier are placed in a line. This causes the phase of the color subcarrier relative to the horizontal reference point to change by 180° each line.
Horizontal reference point
In order to indicate the location of the video signal clock pulses in time, a reference point is needed. In NTSC this is called a horizontal reference point. It is used as a reference for synchronizing the beginning of each line of a television signal and determines the moment from which all timing parameters in the line are counted, including sync pulses, colorburst and the active part of the video signal.
Previously, I showed it on a schematic oscillogram for HBI. Don't be confused by the fact that it is a line. In reality, the signal values do not change instantly, and the signal edges are not strictly vertical. It is called a point because it is located on the negative front when it reaches the 50% threshold.
Composite Video Testing
I didn't look at how the video signal is encoded and decoded in hardware, since we'll look at software generation in the next article. For now, I’ll just tell you a little about how and with what help they check the correctness of the video signal.
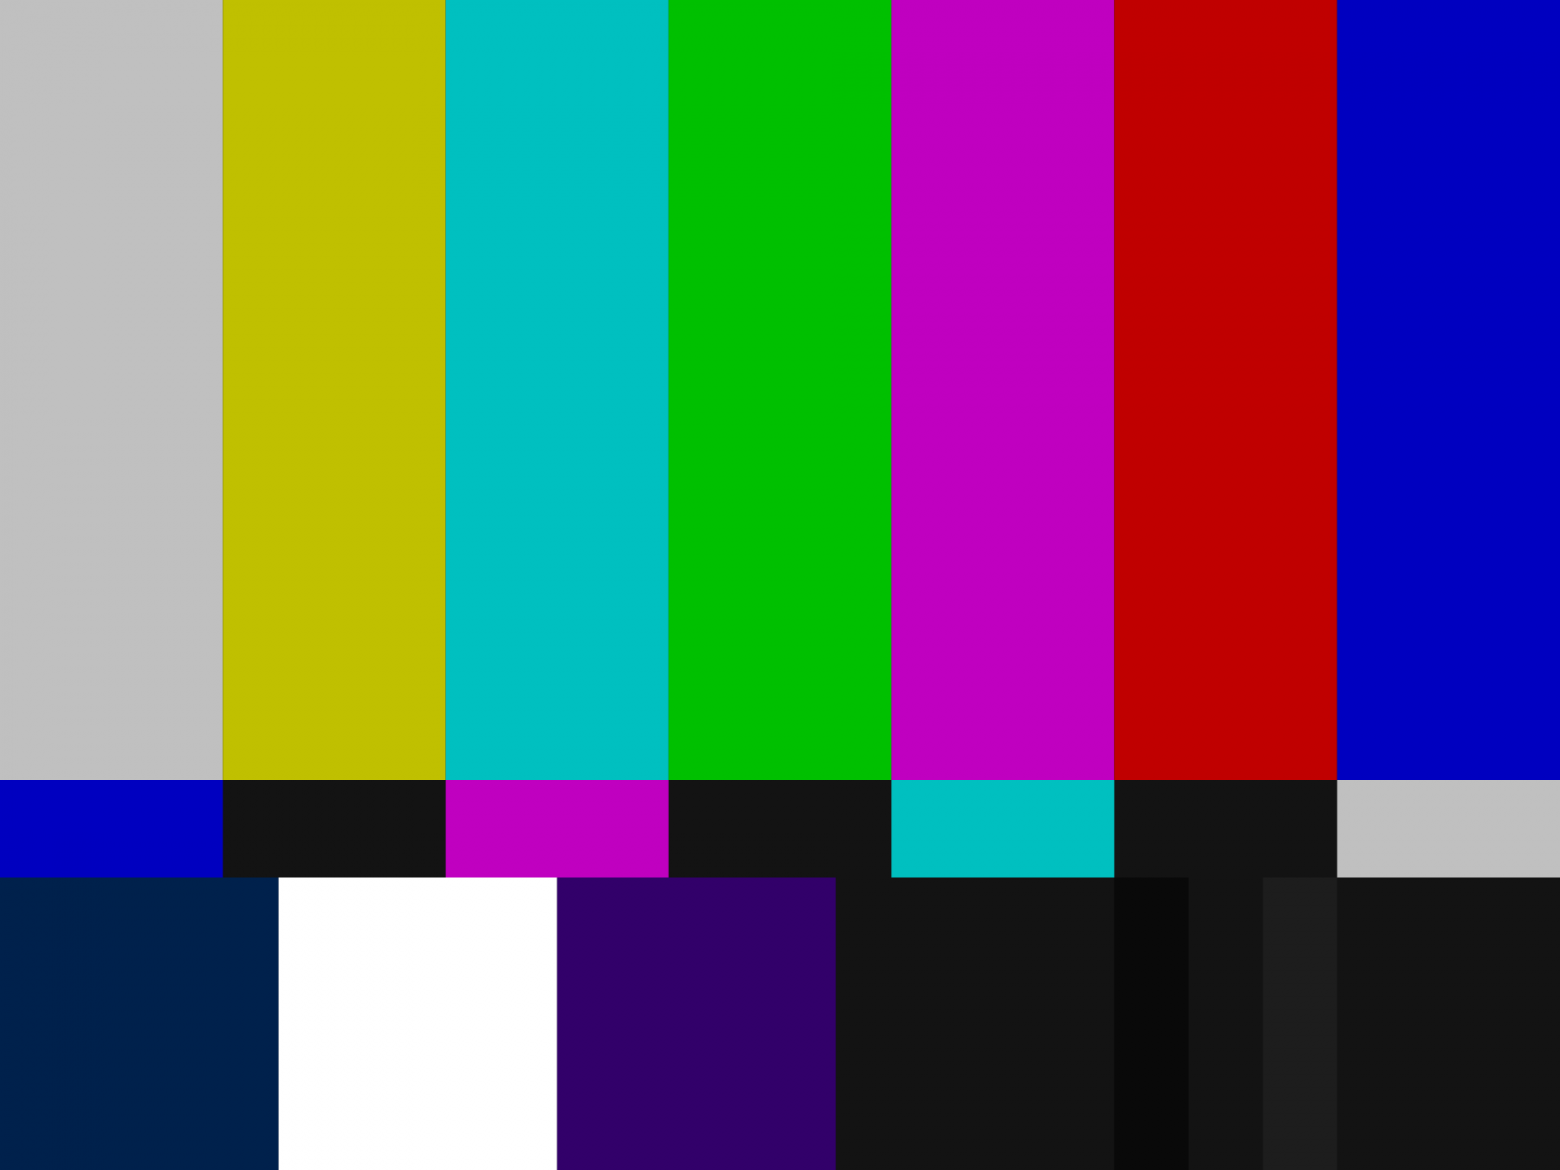
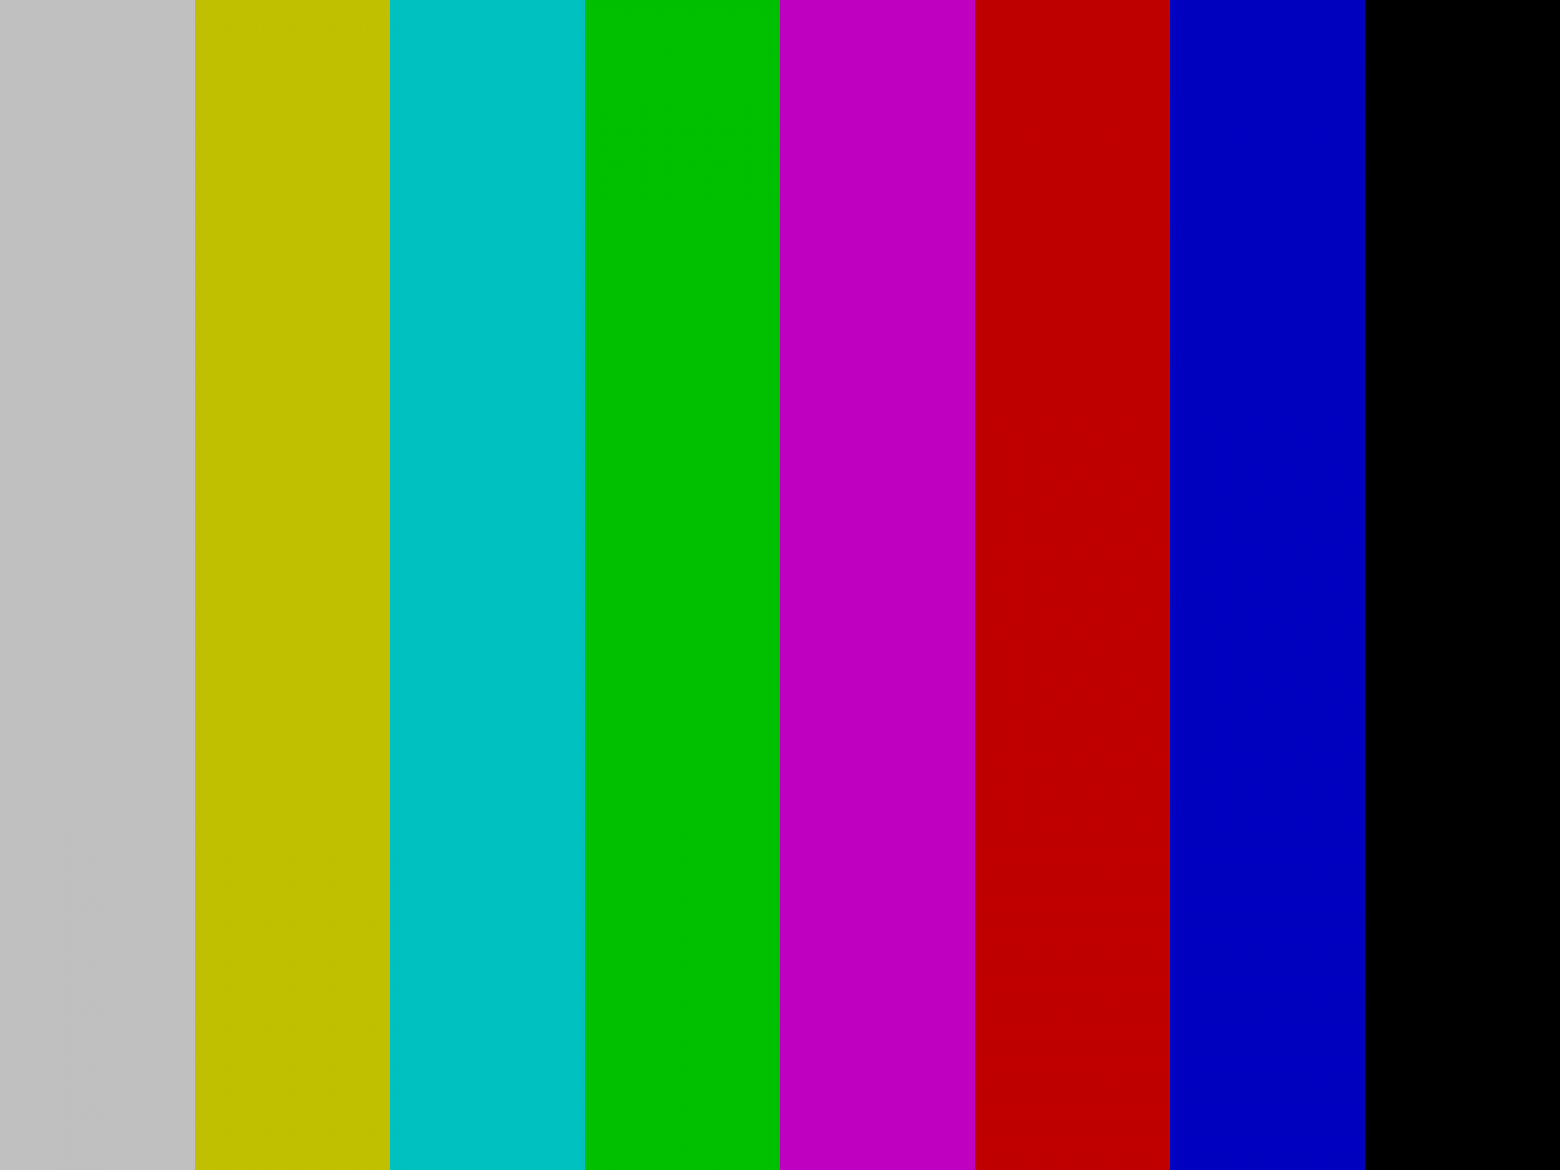
Video signals are tested using television test patterns. For example, such as EBU color bars and SMPTE color bars. You saw them when the television broadcast was interrupted due to unforeseen circumstances at the television center.
You can, of course, visually assess the quality of the resulting picture, but for a deeper analysis of the composite video signal, oscillograms and vectorograms are used. They complement each other and allow you to get a complete picture of the structure and quality of the signal.
Oscillograms
The waveform shows the amplitude of the video signal in the time domain. It is used to analyze timings and signal levels, as well as the presence of various noises in the signal.
With its help, the levels of clock pulses, the level of “black” (setup), “white” and the amplitude of the color-difference signal are controlled, as well as the duration of the pulses, the line frequency, and the presence of jitter.
Vectorograms
A vectorogram displays the color information of a signal in polar coordinates, showing the phase and amplitude of the color subcarrier. It is used to analyze color and check color balance. You can use it to check that colorburst has the correct phase, and that the color bars of the tuning table have the correct phases. The vectorogram allows you to check the correctness of the phase and color amplitude.
An image of SMPTE color bars and a vectorogram for it are shown below.
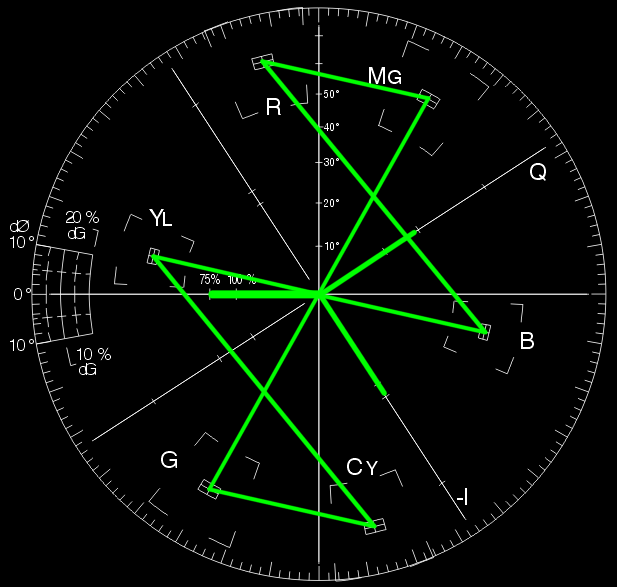
The lines you see in a vectorogram occur because the vectorscope does not attenuate the beam as it transitions from one color to another.
Since the vectorscope visually displays the phase and amplitude of the chromaticity signal, white and black colors on the vectorscope will be displayed by the same point in the center of the vectorogram.
Colorburst and the I and Q axes can be displayed in a vector diagram; It is enough to generate colors in the image with the same phase as colorburst, and I and Q non-zero amplitude.
Even though I was building an NTSC encoder, I used a test image similar to the EBU Color Bars used for the PAL signal to test the operation.
Conclusion
Well, the first article in the series has come to an end. I hope you didn't get bored and learned something new. I promise that the next article will be more interesting, since in it I will talk about how to generate a CVBS signal.
In this article, you saw that analog video signals cut across multiple disciplines and are a good example of applying the knowledge we learned in school and college. We also looked at the basic concepts of colorimetry, which is used when working with photo and video images.
For the sake of clarity, I only included information in the article that we will need in the next article. In it you will see how to use the technologies used in microcontrollers to generate a video signal.
In the meantime, you can deepen your knowledge by looking at the sources that I provide below.
Useful links
Printed publications
Wyszecki, G., Stiles, W. S. Color Science: Concepts and Methods, Quantitative Data and Formulae. — 2nd ed. — New York: Wiley, 1982. — 950 p.
Colorimetry: Understanding the CIE System / ed. by J. Schanda. — Hoboken, NJ: Wiley-Interscience, 2007. — 459 p.
Benson, K. B., Whitaker, J. C. Television Engineering Handbook: Featuring HDTV Systems. — Rev. ed. — New York: McGraw-Hill, 1992. — 1500 p.
Conrac Corp. Raster Graphics Handbook. 2nd ed. New York: Van Nostrand Reinhold, 1985. 345 p.
Jack, K. Video Demystified: A Handbook for the Digital Engineer. — 5th ed. — Oxford: Newnes, 2005. — 928 p.
Iceberg, E. D., Duri, J. Color television?... It's almost simple! — 2nd ed. - M.: Knowledge, 1975. - 144 p.
Mamchev, G.V. Fundamentals of radio communications and television: textbook. - M.: Hotline - Telecom, 2007. - 416 p.
Tektronix 1725 (SN B040000 and Above) PAL/NTSC Vectorscope: Instruction Manual [Electronic resource]. - Beaverton, OR: Tektronix, Inc., 1994. - 150 p. — URL: https://download.tek.com/manual/070763504_0.pdf (date of access: 10/06/2025).
Standards
SMPTE 170M-2004. Television — Composite analog video signal — NTSC for studio applications / Society of Motion Picture and Television Engineers. — White Plains, NY : SMPTE, 2004.
SMPTE EG 27:2004. Supplemental Information for SMPTE 170M and Background on the Development of NTSC Color Standards / Society of Motion Picture and Television Engineers. — White Plains, NY : SMPTE, 2004.
GOST 24375-80. Radio communication. Terms and definitions. — Enter. 01/01/1982. - M.: Publishing house of standards, 1980. - 53 p.
GOST 21879-88. Broadcast television. Terms and definitions. — Enter. 01/01/1990. - M.: Publishing house of standards, 1988. - 23 p.
Internet links
Color: from hexadecimal codes to the eye -
Color: From Hexcodes to Eyeballs — https://jamie-wong.com/post/color/
Additive color spaces in colorimetry -
Video Basics — https://www.analog.com/en/resources/technical-articles/basics-of-analog-video.html
Standard Color Bars — https://www.mivs.com/standard-color-bars/
© 2025 MT FINANCE LLC
Why This Matters In Practice
Beyond the original publication, Understanding NTSC composite video and whether it's worth exploring in 2025. Part 1 matters because teams need reusable decision patterns, not one-off anecdotes. Previously, circuitry solutions were required to generate a composite video signal, but now the problem can be solved using a microcontrolle...
Operational Takeaways
- Separate core principles from context-specific details before implementation.
- Define measurable success criteria before adopting the approach.
- Validate assumptions on a small scope, then scale based on evidence.
Quick Applicability Checklist
- Can this be reproduced with your current team and constraints?
- Do you have observable signals to confirm improvement?
- What trade-off (speed, cost, complexity, risk) are you accepting?
FAQ
What is this article about in one sentence?
This article explains the core idea in practical terms and focuses on what you can apply in real work.
Who is this article for?
It is written for engineers, technical leaders, and curious readers who want a clear, implementation-focused explanation.
What should I read next?
Use the related articles below to continue with closely connected topics and concrete examples.